GNSS atmospheric water vapor time series for NWP model assimilation
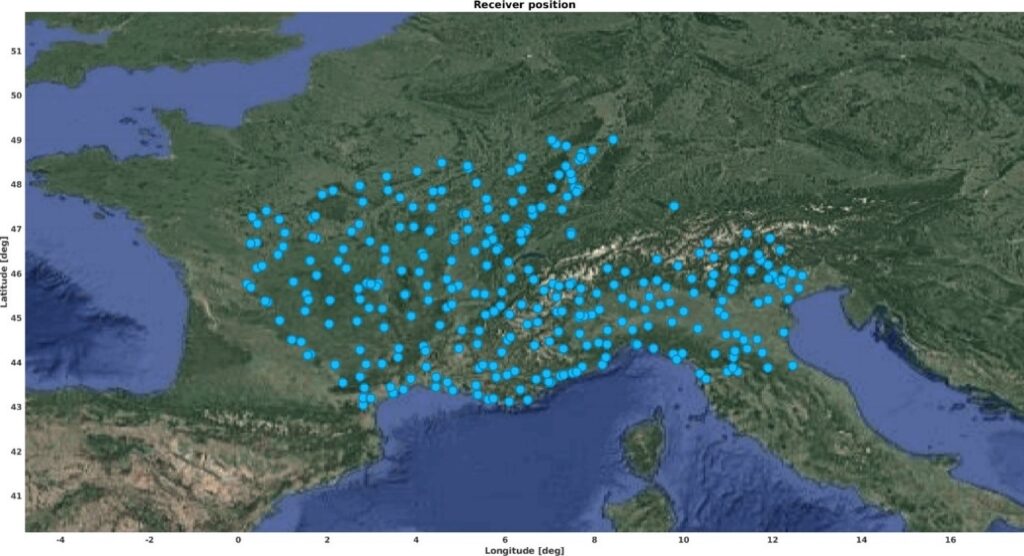
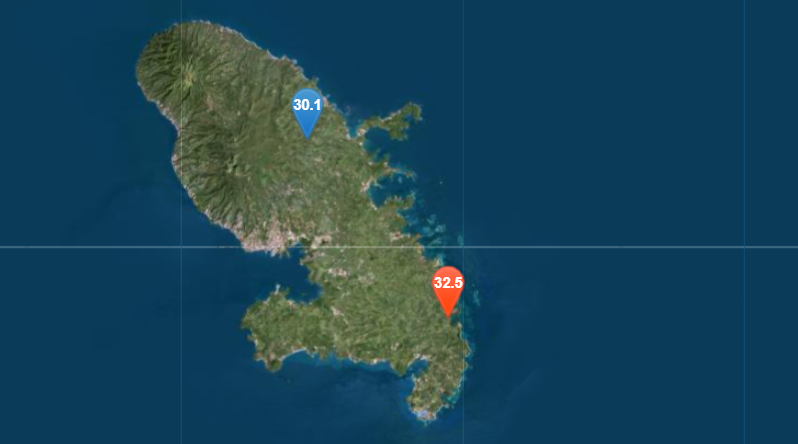
For the Italy and France domain, a total of 397 third-party GNSS permanent stations were selected from various global, national, and regional permanent GNSS station networks.
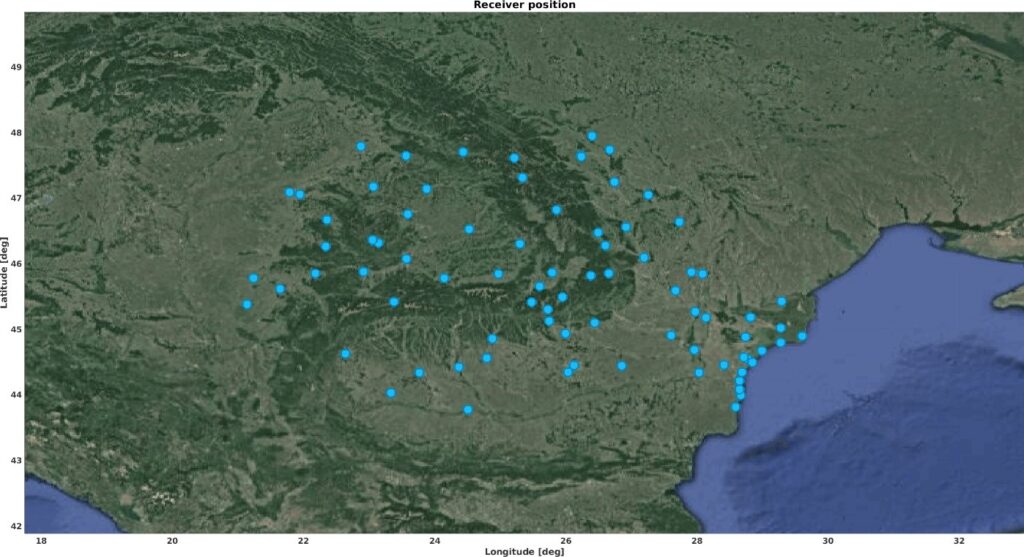
For the Romania domain, a total of 74 third-party GNSS permanent stations were selected from various global, national, and regional permanent GNSS station networks.
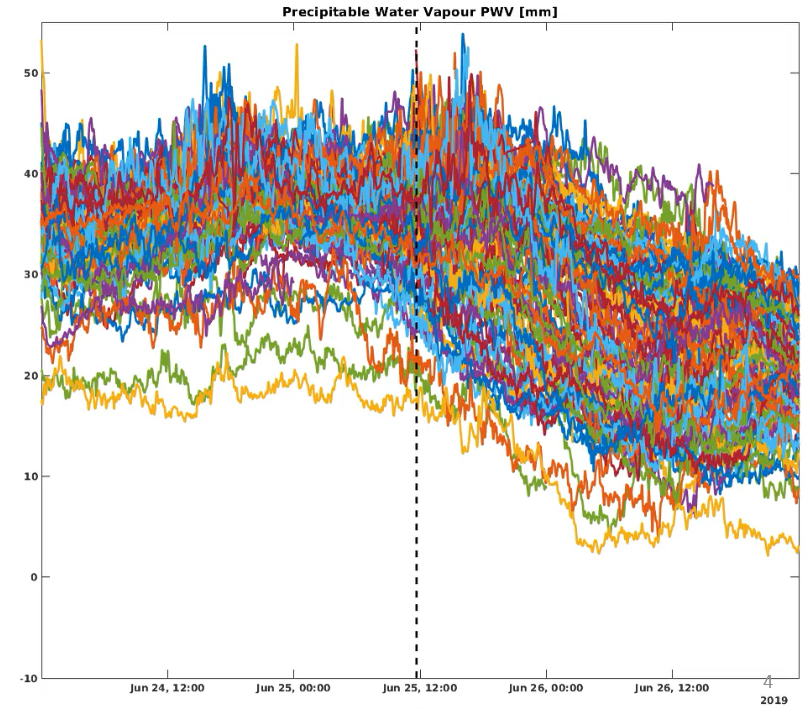
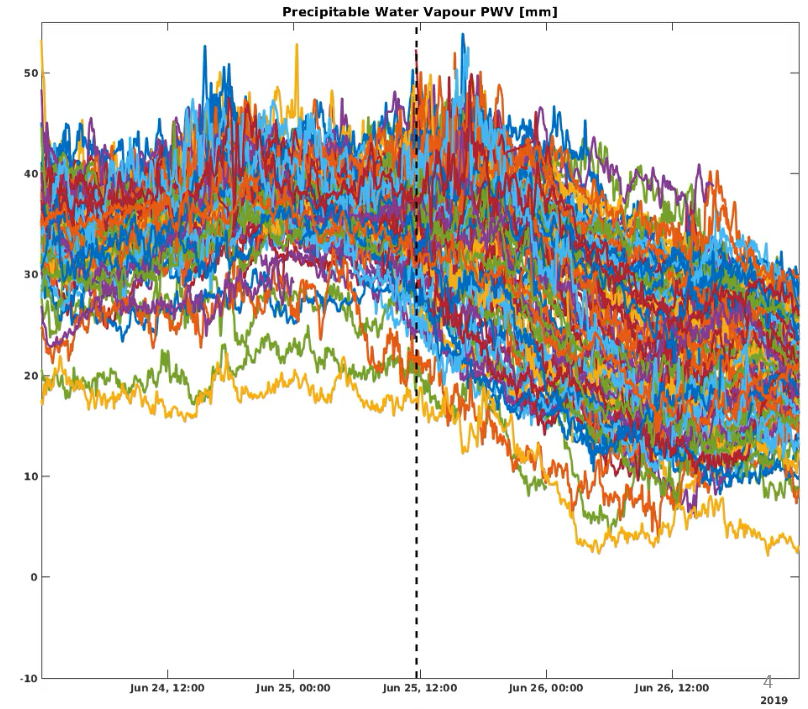
Figure 3 displays the temporal variation of GNSS atmospheric water vapor occurred during the rainfall events of 25th of June 2019 in Romania: each colour represents one of the 74 considered GNSS permanent stations. The time series clearly shows two peaks of atmospheric water vapor content during June 24th and 25th, followed by a general decreasing trend in content after the conclusion of the heaviest rainfall events. By spatially interpolating the GNSS atmospheric water vapor values with the GNSS meteorology post-processing routines of Breva software, it is possible to obtain water vapour maps. The maps allow for the identification of areas with high water vapor levels (e.g., the white area in the top-central part of the map), that are more suitable for the development of heavy rainfall events.
Author: Stefano Barindelli, Eugenio Realini
Links
Data assimilation into meteorological models– How MAGDA project is moving to help agriculture.
Keywords
GNSS, atmospheric water vapor, Breva software, NWP model, innovation, technology, drones, IoT, sensors, farming
Sources
Lagasio, M., Pulvirenti, L., Parodi, A., et al. (2019). Effect of the ingestion in the WRF model of different Sentinel-derived and GNSS-derived products: Analysis of the forecasts of a high impact weather event. European Journal of Remote Sensing, 52(sup4), 16-33.
Torcasio, R. C., Mascitelli, A., Realini, E., Barindelli, S., et al. (2023). The impact of global navigation satellite system (GNSS) zenith total delay data assimilation on the short-term precipitable water vapor and precipitation forecast over Italy using the Weather Research and Forecasting (WRF) model. Natural Hazards and Earth System Sciences, 23(11), 3319-3336.
